Dietary survey planning: vitamin D baseline checklist
Most national nutrition surveys treat vitamin D the way they treat sodium or fibre: ask what people ate, multiply the answers by food composition tables, and call the result a baseline. For sodium, that logic is imperfect but usable.
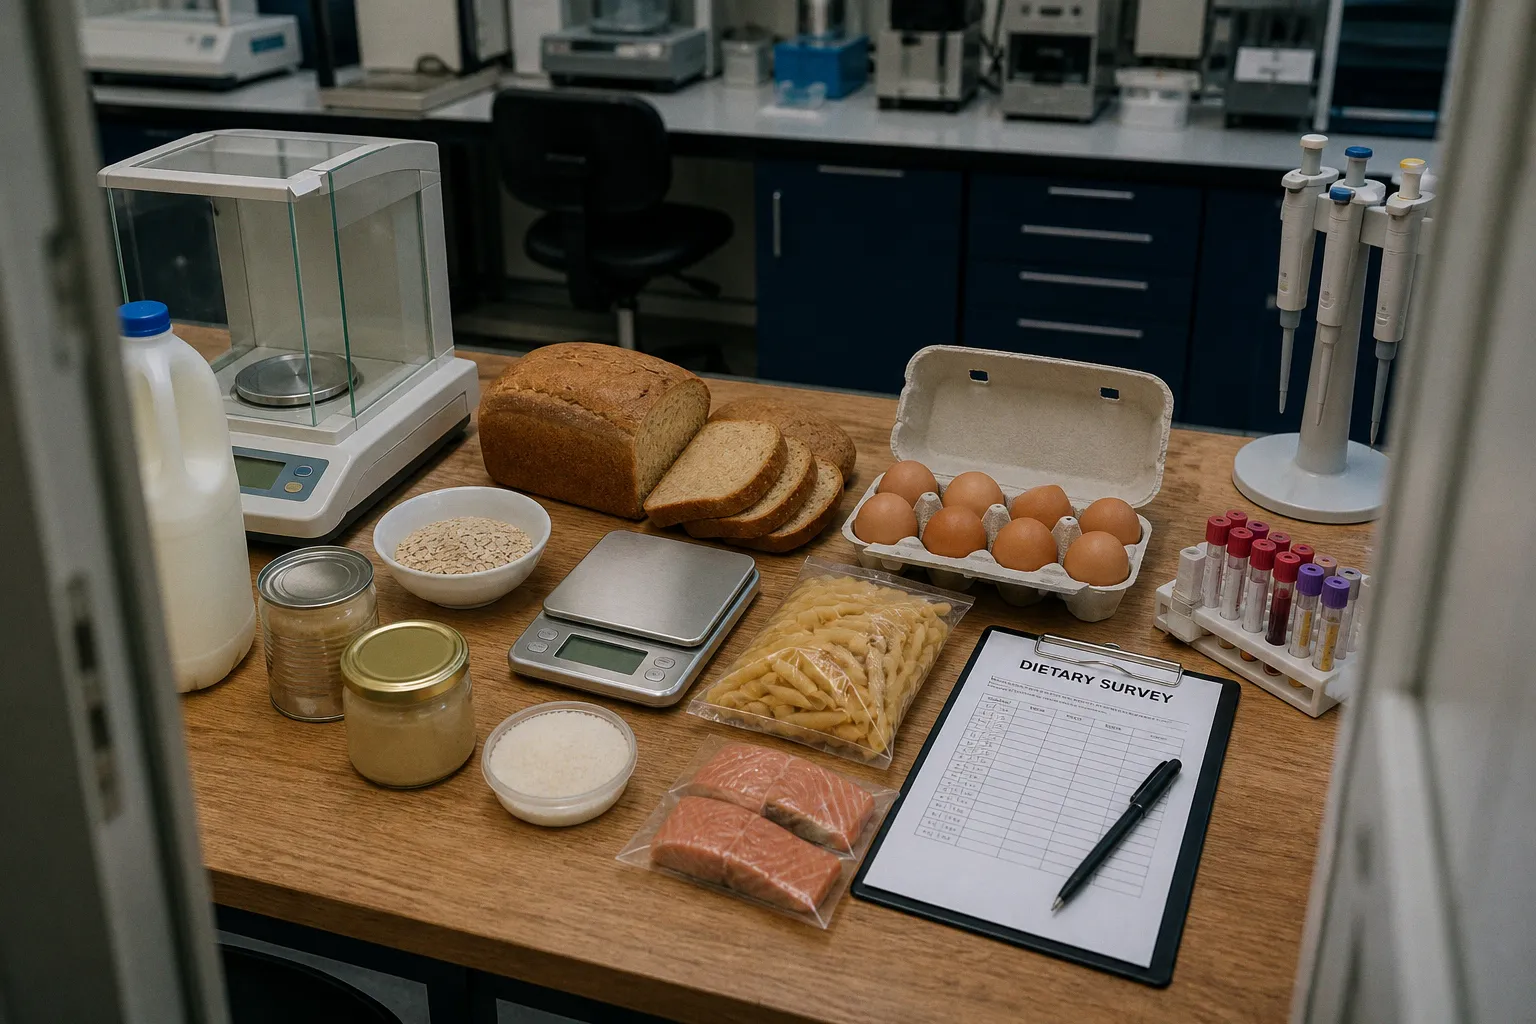
For vitamin D, it collapses much faster, because the variable a public-health programme usually needs to understand — what the body is doing with the nutrient — sits in serum, not on a plate.
Every survey that ships without a 25(OH)D biomarker component should be described honestly. It may be a dietary intake survey. It may be useful for estimating exposure to fortified foods or supplements. It is not, by itself, a population vitamin D status baseline.
The distinction matters most when the data will be used to design or evaluate food fortification. Intake data can show whether people report eating fortified milk, oily fish, spreads or supplements. It cannot show whether those exposures translate into an adequate circulating status across different ages, seasons, latitudes, skin pigmentation groups and patterns of outdoor activity. That requires a measurement of status alongside the dietary record.
This checklist rests on five methodological pillars: combining biomarkers with dietary intake data; choosing reference values before analysing the results; validating tools against the foods that actually carry vitamin D; accounting for cutaneous synthesis and season; and connecting the survey to the regulatory conditions governing infant formula and population-level fortification.
The language is blunt because the field deserves bluntness. Countries have repeatedly run intake-only surveys, watched the resulting “deficiency prevalence” estimates move with the calendar, and then treated the movement as a policy result.
Integrating biomarkers with dietary intake data
The most common methodological error in vitamin D baseline work is the assumption that intake equals status. It does not. Two people consuming similar amounts of dietary vitamin D can have substantially different serum 25(OH)D concentrations because cutaneous synthesis, body composition, absorption, supplement use, recent sun exposure and individual metabolism intervene between the meal and the blood sample.
That is not a minor adjustment to make at the end of the analysis. It is the central biological problem.
Vitamin D status is therefore measured, not inferred from the food questionnaire. The relevant biomarker is serum 25-hydroxyvitamin D, written as 25(OH)D. It reflects circulating vitamin D metabolites over a longer period than a single meal or a single day of intake. The active hormone 1,25-dihydroxyvitamin D, or calcitriol, is not a substitute. Its concentration is tightly regulated and can remain stable, or change for reasons related to calcium and phosphate homeostasis, even when vitamin D stores are inadequate. A survey that measures calcitriol and presents it as a vitamin D status baseline is reading a downstream control signal and treating it as a reservoir.
A defensible national nutrition survey should decide at the design stage how the dietary and biomarker components will be linked. The blood sample and dietary assessment do not necessarily have to occur on the same day, but the interval must be defined and justified. Supplement use, recent illness, changes in diet and the timing of fortified-food consumption all become harder to interpret when the two measurements are collected without a clear relationship.
At minimum, the biomarker arm needs to address:
- Specimen collection. Venous blood is the conventional route. Dried blood spots can be useful in large or geographically dispersed surveys, but only when the collection, storage, transport and analytical method have been validated for the intended population and matrix.
- Analytical comparability. The laboratory method should be standardised and its traceability documented. LC-MS/MS can provide detailed measurement, while immunoassays may be practical at scale; the important point is not to treat results from different methods as automatically interchangeable.
- Quality assurance. External quality-assurance participation, calibration procedures, internal controls and handling of assay changes need to be recorded. A national estimate is only as stable as the laboratory system behind it.
- Metadata. Month of collection, latitude or region, supplement use, recent sun exposure, fasting state where relevant, pregnancy status and major health conditions should be available for interpretation.
- Population structure. Children, adolescents, adults, older people, pregnant women and other priority groups may have different exposure patterns and different policy needs. A single unstratified average can conceal the groups for whom fortification is most consequential.
The dietary component still matters. A biomarker tells you about status; it does not tell you which part of the food supply, supplementation pattern or fortification policy produced that status. Without intake data, a low serum value is difficult to connect to an intervention. Without the biomarker, an intake estimate remains an exposure model with a large biological question left unanswered.
Serum 25(OH)D tells you what the population has. Dietary data helps explain where it came from. A baseline needs both lines of evidence.
The survey should also distinguish vitamin D from total vitamin D exposure. Food sources, supplements and fortified products must be coded separately. Otherwise, a high estimated intake may simply reflect supplement use in a small subgroup, while the ordinary food supply contributes little. That distinction is essential when the proposed intervention is fortification rather than supplementation.
Aligning survey metrics with EFSA and SACN reference values
Once biomarker and intake data exist, the survey still needs a defined yardstick. That yardstick should be selected before the main results are interpreted. Otherwise, the reference value can become a political variable: one threshold for the technical report, another for the press release, and a third when the policy is being defended.
For dietary intake, EFSA’s Adequate Intake for vitamin D is 15 µg per day for healthy individuals over one year of age, including pregnant and lactating women, under the assumption of minimal cutaneous synthesis. For infants aged 7 to 11 months, EFSA gives an Adequate Intake of 10 µg per day. These are European reference values, not a universal description of every national recommendation.
SACN, the UK Scientific Advisory Committee on Nutrition, uses a different framework for the UK population, with a Safe Intake recommendation in the range of 8.5 to 10 µg per day. The difference is not an arithmetic error. It reflects different assumptions about the population, sun exposure and the purpose of the recommendation. The same dietary dataset can therefore produce a different apparent level of inadequacy depending on whether it is compared with the EFSA AI or the SACN value.
That is why the report must state, in plain language:
1. Which reference value was used for each age group.
2. Whether the value applies to dietary intake, total exposure or a specific season.
3. Whether supplements were included.
4. Whether the reference assumes minimal cutaneous synthesis.
5. Which reference was used for the primary analysis and which were used only for sensitivity analysis.
A country-specific recommendation must not be invented by importing a European value into a national column. In Finland, for example, national nutrition guidance should be represented as current Finnish guidance, with its own age-specific structure and scope. EFSA’s 15 µg/day AI may be shown as a separate European comparator, but it should not be relabelled as a uniform Finnish benchmark for everyone over one year of age.
The table below is the kind of distinction a report should make. It deliberately separates European and UK reference frameworks from national guidance rather than pretending they are interchangeable.
| Reference framework | Population covered | Intake value or approach | How to use it in a survey |
|---|---|---|---|
| EFSA | Healthy individuals over one year of age | Adequate Intake of 15 µg/day, assuming minimal cutaneous synthesis | Use as the stated European comparator for the relevant age groups |
| EFSA | Infants aged 7–11 months | Adequate Intake of 10 µg/day | Keep separate from values for older children and adults |
| SACN, UK | UK population | Safe Intake in the range of 8.5–10 µg/day | Use within the UK framework and explain the population assumptions |
| Finnish national guidance | Finnish population | Apply the current age-specific national recommendations | Do not replace national guidance with a uniform EFSA value |
| Serum 25(OH)D assessment | Survey population | Predefine the concentration thresholds and units used for interpretation | Report the threshold, season, assay method and uncertainty together |
The biomarker side needs the same discipline. A serum 25(OH)D threshold is not simply a natural fact waiting to be copied into a table. Different organisations and studies use different categories, and thresholds may be framed as deficiency, inadequacy, sufficiency or risk. Some analyses use 50 nmol/L as a population-level reference point; other literature uses lower or higher cut-offs for particular purposes. A report should not quietly switch between them.
More importantly, a threshold should be interpreted with the distribution around it. If the national estimate is close to a cut-off, assay uncertainty, seasonal timing and sampling error may change the classification of a meaningful share of participants. Reporting only the percentage below a threshold creates false precision. The full distribution, confidence intervals, subgroup results and collection period are more informative than a single headline number.
The reference value also determines what the survey is capable of saying. An intake survey can estimate the proportion of participants whose reported intake falls below a dietary reference value. A biomarker survey can estimate the proportion whose serum concentration falls below a selected status threshold. Those are related but different outcomes. They should not be merged into one vague statement that the population is “deficient.”
A reference value chosen after the results are visible is not a reference value. It is a post-hoc argument with a number attached.
Validating assessment tools for high-vitamin-D food groups
Dietary assessment for vitamin D is unusually vulnerable to small coding errors because the meaningful sources are concentrated. In many European diets, a relatively short list of foods contributes much of the dietary intake: oily fish, fortified milk and other fortified dairy products, fortified margarines or spreadable fats, and, depending on the country, fortified yoghurt or sour milk products.
That concentration is useful. It means a survey does not necessarily need a gigantic food-frequency questionnaire to monitor vitamin D exposure. It does, however, need a tool that reflects the actual food supply. A beautifully validated questionnaire from another country can become a poor instrument when the brands, fortification practices, serving sizes and consumption habits change.
A focused vitamin D questionnaire can work for population surveillance when it has been validated against repeated food records or another suitable reference method in a subsample. The validation should test whether the instrument captures the major food groups and ranks participants reasonably at the group level. It should not be presented as proof that the questionnaire measures an individual’s exact vitamin D intake.
That distinction is not academic. A short tool may identify broad patterns across regions or age groups while performing badly for a person who eats oily fish irregularly, uses a fortified spread only occasionally, or takes supplements in bursts. Group surveillance and individual clinical assessment are different jobs.
For a national survey, validation should examine:
- Whether the questionnaire includes all major fortified products in the current market.
- Whether fortification is mandatory, voluntary or brand-specific.
- Whether the tool records product type and brand when fortification levels vary.
- Whether portion sizes match local packaging and consumption practices.
- Whether supplement use is captured by product, dose, frequency and duration.
- Whether seasonal foods and occasional fish consumption are represented.
- Whether the food list can be updated when reformulation changes the nutrient content.
- Whether the method has been tested in children, older adults and other groups with different eating patterns.
The reference method also needs to be chosen with care. A single 24-hour recall can miss episodic foods. A single food record can overrepresent the days on which participants are unusually attentive. Repeated recalls or multi-day records provide a better comparison, particularly when the aim is to estimate usual intake rather than describe one day.
The food composition database is where many apparently precise surveys become fragile. Vitamin D values for fortified foods are not stable properties in the way that the energy content of plain water is stable. They depend on the product, recipe, fortification practice, analytical method and database update. National food tables may have strong coverage for traditional foods but weak coverage for new fortified products. European comparison becomes difficult when one country codes a product according to a current label and another relies on an old generic entry.
EFSA’s Open Access European Food Composition Database can provide a common backbone for cross-country work, but it does not remove the need for national verification. The database must be checked against the products actually available during the survey period. Where the food supply has changed, the report should say whether values came from laboratory analyses, manufacturer data, national tables or generic assumptions.
A useful approach is to maintain a separate fortification register alongside the food composition database. That register can record:
- Product category and market name.
- Declared vitamin D concentration.
- Sampling or observation date.
- Whether the value is a target, a label declaration or a laboratory measurement.
- The serving size used in the dietary instrument.
- Any reformulation or product replacement during fieldwork.
This matters especially when the survey is intended to evaluate a policy. If the database assumes that every product meets a fortification target, it can turn regulatory intention into apparent dietary exposure. The survey then reports what should have been eaten rather than what was available and consumed.
Accounting for cutaneous synthesis and seasonal variability
Vitamin D is unusual among nutrients because diet is often only one part of the exposure picture. Cutaneous synthesis from UVB radiation can make a substantial contribution to vitamin D status, depending on latitude, season, skin pigmentation, age, clothing, sunscreen use, time outdoors and the amount of exposed skin. A dietary baseline that ignores these variables is measuring a moving biological target with a stationary ruler.
Season is not a nuisance variable to be adjusted away after collection. It can change the meaning of the biomarker itself.
Serum 25(OH)D is generally higher in late summer and autumn, after months when UVB exposure supports cutaneous synthesis. It is generally lower in late winter or early spring, after the period of reduced effective UVB exposure and gradual depletion of the previous season’s stores. The exact pattern differs between populations and individuals, but the direction is methodologically important.
A single cross-sectional sweep taken entirely in autumn will tend to capture relatively higher population status. A sweep taken in late winter or early spring will tend to capture relatively lower status. Neither design can cleanly estimate the year-round situation without a seasonal model or a comparison group. More importantly, a late-winter survey should not be described as evidence that a fortification policy has failed without accounting for the season in which the sample was collected.
The original error in many reports is not simply choosing the wrong month. It is assigning the wrong meaning to the month. Autumn is not a period that systematically underestimates status. Late winter is not a period that artificially inflates the apparent effect of fortification. The usual seasonal pattern runs in the opposite direction: status tends to peak after summer exposure and reach lower levels toward the end of winter.
The design response is straightforward, although not always cheap:
- Spread blood collection across the seasons rather than concentrating all fieldwork in one window.
- Use seasonal sampling quotas if the survey must support comparisons over time.
- Record month and region for every specimen.
- Include latitude or another geographic variable that reflects UVB availability.
- Collect information on time outdoors, clothing, sunscreen and recent travel where relevant.
- Record vitamin D supplementation separately from food intake.
- Predefine whether the primary estimate is annual, season-specific or seasonally standardised.
- Keep the collection calendar stable in repeated survey waves.
The survey does not need to pretend that self-reported sun exposure is an exact dose of UVB. It is not. The point is to avoid treating all participants as if they had identical cutaneous synthesis. A short set of consistent questions can help explain some of the variation and identify groups for whom dietary fortification may be more important.
The interpretation also needs restraint. Sun exposure does not guarantee adequate vitamin D status. High latitude, dark skin pigmentation, indoor lifestyles, older age and cultural clothing practices can all limit cutaneous synthesis. Winter conditions can reduce effective UVB even where the weather looks bright. Conversely, a population with substantial sun exposure may show higher serum values without having a robust dietary intake or a stable year-round status.
That is why “sunny country” is not a valid proxy for “no vitamin D problem.” It is a context variable, not a conclusion. A baseline should show how status changes across the calendar and which groups remain vulnerable when sunlight is theoretically available.
Latitude is not a vitamin D source. It is a variable in the equation, and the equation is not optional.
Seasonal design is also essential for policy evaluation. Suppose fortification begins before the second survey wave. If the first wave was collected in late winter and the second in autumn, an apparent increase in serum 25(OH)D may reflect both the intervention and the calendar. If the order is reversed, the policy effect may be masked by the natural seasonal decline. The only honest options are to collect comparable waves in comparable months, sample throughout the year, or model season explicitly and report the assumptions.
Regulatory compliance in infant and population-level fortification
A baseline survey is rarely an end in itself. It exists to inform, evaluate or defend a fortification or supplementation policy. Survey designers who ignore that policy context often measure the wrong things with impressive precision.
Infant feeding requires particular care because age, formula type and volume consumed can change rapidly. In the European Union, Commission Delegated Regulation (EU) 2019/828 sets a binding vitamin D range for infant formula of at least 2 µg and no more than 2.5 µg per 100 kcal. An infant survey that ignores the applicable product category, preparation instructions and consumed volume cannot reliably estimate exposure, even if the questionnaire appears detailed.
The field instrument should distinguish formula prepared according to instructions from formula prepared more or less concentrated than instructed. It should record the product identity where possible, the type of formula, the number of feeds and the transition between breast milk, formula and complementary foods. Breastfeeding and formula feeding are not interchangeable exposure categories, and a national estimate that collapses them together can conceal the policy-relevant pattern.
For population-level fortification, Finland offers a useful example of why policy evaluation requires product-level information. The Finnish Food Authority’s recommendations specify fortification targets for selected liquid dairy products and spreadable fats, with different concentrations for those categories. The survey should use the current national recommendations and verify how they apply to the products being consumed. It should not replace them with a generic European intake value.
A survey designed to evaluate voluntary or mandatory fortification needs more than a question asking whether participants consume dairy. It needs to know:
- Which product category was consumed.
- Whether the product was fortified.
- The declared or measured vitamin D concentration.
- The amount consumed.
- Whether the product was a standard, reduced-fat or specialty version.
- Whether the product was purchased domestically or imported.
- Whether the food database reflects the formulation in the fieldwork period.
Where feasible, sampled products should be tested for actual vitamin D content. The target concentration, the label declaration and the laboratory result are three different pieces of information. The gap between them is not merely a technical inconvenience. It can show whether the fortification policy is reaching the food supply in the form regulators intended.
The same principle applies to voluntary fortification. A product may be legally permitted to contain vitamin D without being consistently available, consistently purchased or consistently consumed. A food supply analysis can therefore complement the dietary survey by documenting market coverage. Otherwise, the model may assume that a fortified option is widely accessible when it is in fact limited to a small number of brands or regions.
The Tolerable Upper Intake Level must remain visible as well. EFSA’s UL for vitamin D in adults is 100 µg per day. This does not mean that every participant approaching the value has experienced harm, nor does it turn a dietary survey into a clinical assessment. It does mean that intake distributions should be examined in both directions. A fortification policy designed to reduce inadequate intake should not be evaluated only by counting people below a reference value while ignoring high-dose supplements and combined exposure from several fortified products.
The upper tail may be small, but it can be policy-relevant. High-dose supplement use may cluster in particular groups, and the combination of supplements with fortified foods can be missed if the questionnaire records only habitual food consumption. Supplement questions should therefore capture the product, dose, frequency and duration rather than a binary yes-or-no answer.
Infant and population-level policies also require different reporting structures. An infant formula exposure estimate cannot be compared directly with an adult dietary intake estimate without accounting for energy intake, age-specific guidance and product composition. Likewise, an adult population average can hide the exposure pattern among pregnant women, older adults or people who rarely consume fortified foods.
What the baseline actually has to deliver
A defensible national vitamin D baseline survey is not a long questionnaire followed by a press conference. It is an integrated measurement system: a serum biomarker, a validated dietary instrument, a stated reference framework, seasonal sampling, and an explicit connection to the fortification or supplementation policy the data is meant to inform.
The practical test is whether the survey can answer five questions without changing definitions halfway through the report:
1. What is the population’s serum 25(OH)D distribution?
The answer should include the assay method, quality assurance, units, sampling season and uncertainty.
2. What dietary and supplemental exposures are associated with that distribution?
Food groups, fortified products and supplements should be separated rather than combined into one total that hides the source.
3. How does status vary by season and population group?
Age, region, latitude, skin pigmentation, outdoor activity, pregnancy, body composition and supplement use may all matter. The survey does not need to measure every possible determinant, but it must not pretend that they are irrelevant.
4. Which reference values are being applied, and why?
EFSA, SACN and national recommendations may serve different purposes. A country-specific recommendation must be reported as country-specific, with its age structure and assumptions intact.
5. Can the results evaluate the policy in the real food supply?
That requires product coding, fortification data, reformulation tracking and, where possible, laboratory verification of selected foods.
If a survey has only dietary intake, it has an exposure study. If it has serum measurements without dietary or supplement information, it has a status survey with limited policy attribution. If it collects both but ignores season, it has a baseline with a built-in interpretive defect. If it uses a reference value without stating its assumptions, it has a technically polished argument waiting to happen.
The strongest design is not necessarily the one with the longest questionnaire. It is the one that makes the biology, the sampling calendar, the analytical method and the policy mechanism line up. A focused dietary tool can be better than an exhausting generic FFQ. A smaller biomarker subsample can be more valuable than a national intake estimate with no status data, provided the sampling and weighting are defensible. A product register can prevent more policy error than another page of dietary questions.
The final report should also preserve the uncomfortable results. If autumn sampling produces higher serum values than late-winter sampling, say so. If the national intake estimate looks adequate while a subgroup’s biomarker distribution does not, show both findings. If actual fortification content falls below the target, report the gap. If a national recommendation differs from EFSA or SACN, explain the difference instead of forcing the numbers into a single ranking.
A baseline that reports only the convenient side of the distribution is not neutral. It is incomplete.
A survey with one methodological pillar can generate a number. A survey with several can generate a useful study. A survey that integrates biomarkers, validated intake data, seasonal design, explicit reference values and real fortification measurements can support policy that survives the next round of scrutiny.
Anything less is another number to argue about. There are already too many of those, and the field has spent too long pretending that a food-frequency questionnaire is the same thing as a measurement. It is not. Serum is serum, intake is intake, and policy decisions built on the confusion between the two are the ones that age the worst.