Vitamin D3 in bread: a baking stability roadmap
A standard wheat bread bake cycle at 200–210 °C for 30 minutes destroys 15% to 20% of the cholecalciferol activity added to the dough. This is not an edge case.
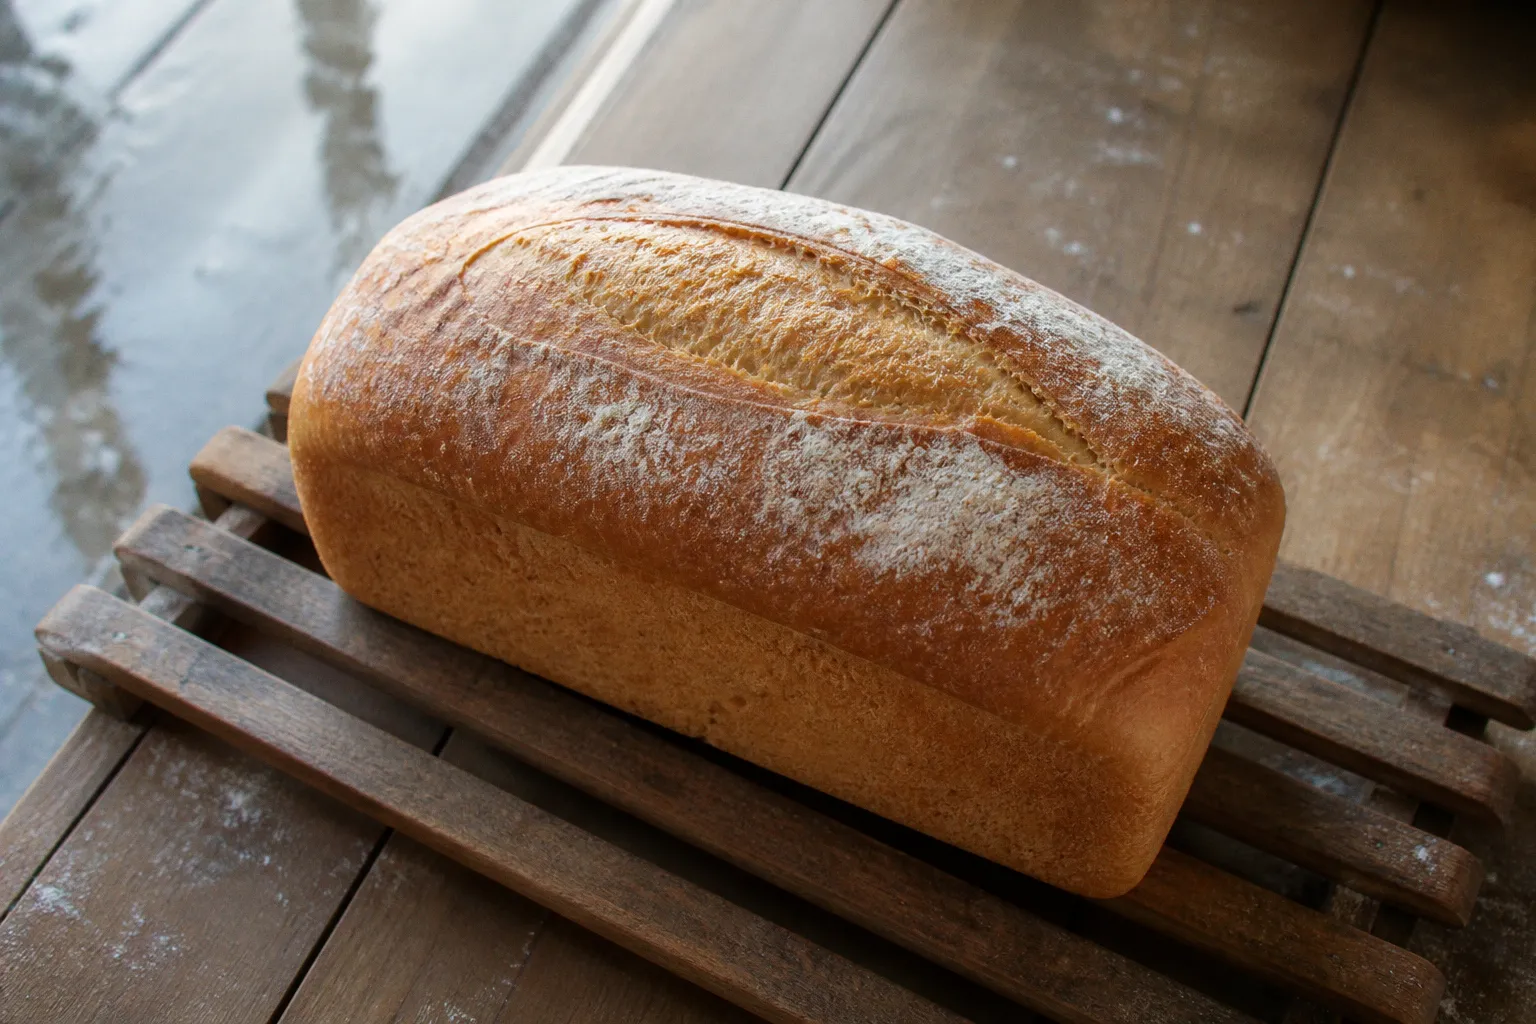
It is the working loss rate that any industrial baker fortifying with vitamin D3 must absorb into the dosage calculation before the flour even reaches the mixer. The thermal window of the oven, not the ingredient cost, not the premix format, not the label claim, is the dominant variable in the retention equation.
For rye matrices the same bake window drops retention to approximately 69%, a gap of 16 percentage points driven almost entirely by dough acidity, not by protein or starch differences. The full retention picture spans storage, fermentation, baking, and post-bake shelf life, with each stage requiring a separate mass-balance step. This roadmap covers each stage in order, identifies the parameters that move the retention number, and closes with a practical dosage compensation framework.
The oven is the loss stage. Storage and fermentation are not.
Thermal degradation kinetics during the baking phase
Cholecalciferol degrades through a thermally driven isomerization and oxidation pathway. The rate constant tracks with crumb core temperature and residence time at that temperature, not with the set-point temperature displayed on the oven panel. Surface temperatures of the crust run 40–60 °C higher than the crumb core and contribute a disproportionate share of the loss, but the bulk volume of the loaf and the assay on the finished product both reflect the integrated crumb response.
In a white sandwich loaf baked at 200–210 °C for 30 minutes, the internal crumb core reaches approximately 98 °C. Under these conditions, vitamin D3 activity loss falls between 15% and 20%. This is the reference band for standard industrial bread production. The figure integrates the thermal dose across the entire bake curve and assumes standard humidity injection at the start of the cycle.
Push the set-point temperature to 200 °C for only 20 minutes without a protective steam or humidity regime, and retention collapses to between 40% and 65%. The shorter bake is not a friend to retention. It concentrates the heat flux in a thinner crust, accelerates surface temperatures, and reduces the protective hydration of the crumb. The combination of higher surface temperature and lower protective moisture is the worst-case geometry for the molecule.
Operational variables that move the retention number inside the oven:
- Crumb core temperature target. The 98 °C reference at 30 minutes corresponds to standard starch gelatinization completion. Lowering the core target to 94–96 °C reduces thermal exposure but compromises starch set and loaf volume.
- Set-point air temperature. 200–210 °C is the working band. Pushing past 220 °C for crust development increases surface losses disproportionately.
- Residence time. Bake time scales roughly linearly with cumulative thermal dose inside the crumb. Every additional minute above 30 minutes adds measurable retention loss.
- Humidity profile. Steam injection at the start of the bake stabilizes the surface and limits the peak crust temperature. Low-humidity profiles accelerate crust browning and vitamin loss at the surface layer.
- Loaf geometry. Thin formats (rolls, flatbreads, pita) expose a higher surface-to-volume ratio to peak oven air. Retention in rolls and flatbreads is consistently lower than in pan loaves.
The dominant lever is the combination of set-point and residence time. Crumb core temperature, monitored by probe in the geometric center of the loaf, is the most reliable single proxy for predicting loss, because it integrates both variables. Oven panel readings should not be used as the sole specification.
Impact of dough pH and grain type on nutrient survival
Grain matrix selection is the second control point. Wheat and rye breads are not interchangeable retention platforms, and the difference is chemical, not structural.
Wheat bread at standard recipe pH (5.4–5.8) retains approximately 85% of added vitamin D3. Rye bread, baked at lower dough pH (4.0–4.8, produced by lactic acid fermentation and the native acidity of rye flour), retains approximately 69% under matched thermal conditions. The 16-percentage-point gap correlates with acidity, not with grain type per se.
The mechanism is acid-catalyzed isomerization of the cholecalciferol molecule. Lower pH protonates degradation intermediates and shifts the equilibrium toward inactive photoisomers and pyrocalciferol at bake temperatures. Wheat sourdough or rye-wheat blends at reduced pH shift the retention profile downward in proportion to the acidity drop. A wheat dough acidified to pH 4.5 behaves like a rye dough, not like a standard wheat dough.
Retention is pH-dependent. Rye is the case where matrix choice overrides oven choice.
Operational implications:
- Pure rye and high-rye blends require an overage factor in the premix dosage. The 69% figure should be treated as the upper bound of an industrial process, not the average. Plant-to-plant variation will skew the distribution downward.
- Wheat sourdough formulations running at pH 4.5–5.0 track closer to rye retention than to standard wheat retention. Dosage compensation applies in full.
- pH-adjusted rye formulas using sodium acetate or calcium acetate buffering can recover retention toward the wheat band, but the additive cost and label declaration impact must be factored in.
- Whole-grain wheat with high aleurone mineral content does not shift retention measurably. The acidity effect dominates the mineral-catalyzed oxidation effect at standard pH.
The grain selection therefore sets the baseline loss. The oven profile modulates it. Neither variable can be ignored when the dosage calculation is finalized.
Dosage compensation strategies for processing losses
The processing loss is not avoidable at industrial scale. It is compensable. Dosage overage is the working answer, and the magnitude of the overage depends on the matrix and the bake profile.
A worked example using the OPTIFORD project target dose of approximately 12 μg vitamin D per 100 g of finished bread:
| Matrix and bake profile | Expected retention | Required dosage in dough (μg/100 g flour basis) |
|---|---|---|
| Standard wheat, 200–210 °C / 30 min with steam | 85% | ~14.1 μg |
| Wheat-rye blend (~30% rye), standard bake | ~75–80% (interpolated) | ~15–16 μg |
| High-acidity rye, standard bake | 69% | ~17.4 μg |
| Low-protection bake (200 °C / 20 min, dry profile) | 40–65% (mid ~50%) | ~24 μg |
The overage ranges from roughly 18% for standard wheat to over 40% for a rye matrix run through a low-protection bake profile. The premix supplier should be specified by final-fortified-food dose, not by flour dose — the industrial formulator must convert before issuing the purchase order. Specifying the premix at flour dose without a conversion factor is a common source of under-fortification in the finished loaf.
A secondary lever is the physical format of the vitamin premix. Dry vitamin D3 stabilized with antioxidants (BHT, BHA, or mixed tocopherols) and bound to a starch, maltodextrin, or gum matrix survives the bake better than oil-based D3 in unprotected suspension. The encapsulation shields the molecule from direct contact with the aqueous dough phase and slows isomerization at the surface of the droplet. Commercial bio-fortified yeast premixes deliver 1360 IU (34 μg) per gram, which simplifies dilution calculations at the flour blender and provides a carrier matrix that disperses evenly through the flour stream.
Quality control on incoming premix should include a certificate of analysis with HPLC assay, not a vitamin activity claim alone. Activity claims can be carried over from the original bulk lot; current-lot assays are the only reliable check.
Stability of vitamin D3 in flour storage and fermentation
Vitamin D3 added to wheat flour is stable through storage and dough processing. The thermal exposure during baking is where the loss occurs — storage and fermentation are not the problem, and they should not be compensated for as if they were.
Flour storage stability: vitamin D3 in fortified wheat flour shows no measurable activity loss after 12 months of storage under standard mill conditions. The dry matrix, low water activity (typically a<sub>w</sub> below 0.6 in flour), and absence of pro-oxidant metals in the free form limit the degradation pathways to near zero. The 12-month figure derives from controlled mill trials; longer storage at the bakery or retail level is plausible but is not characterized in the public dataset.
Dough fermentation stability: vitamin D3 and D2 are stable through fermentation up to 60 minutes. No measurable activity drop occurs during mixing, bulk fermentation, or intermediate proofing. The molecule does not interact with yeast metabolism or with the lactic acid bacteria present in sourdough systems — at least not within the residence times of standard bread processes. Long fermentations (12–24 hour cold retard) have not been systematically characterized, but the absence of a thermal or aqueous driver in those stages suggests no significant additional loss.
The practical implications for the miller and baker:
- Premix shelf life is governed by the carrier formulation, not by the vitamin. Standard dry premixes carry 12–24 month shelf life with no special cold-chain requirement.
- Dough scheduling can run standard or extended fermentation without adjusting the dosage. No compensation is required for proofing time within the data range.
- Storage audits on fortified flour should track water activity and carrier integrity, not vitamin assay. Routine vitamin assays on every flour batch are unnecessary; periodic verification on the incoming premix lot is sufficient.
Fermentation is free. Storage is free. The oven is where the budget is spent.
Evidence from the OPTIFORD project on bioavailability
Retention in the baked loaf is only one half of the equation. Bioavailability — the fraction of the surviving molecule that reaches systemic circulation as active cholecalciferol — closes the loop. A molecule that survives the oven but loses its biological activity is a wasted input, and a molecule that is bioavailable only at half its assay retention is a mislabeled product.
The EU FP5 OPTIFORD project (results published 2006) tested wheat and rye breads fortified at approximately 12 μg vitamin D per 100 g of finished loaf. The intervention delivered three confirmed outcomes relevant to industrial scale-up:
1. Even distribution of the added vitamin throughout the crumb. No hot spots, no segregation in the crust, no concentration gradient between the crumb and the bottom of the loaf. This is a premix dispersion result, not a baking result, but it confirms that the premix formats used in the trial can be scaled to commercial flour blending.
2. Heat stability consistent with the retention numbers above. The OPTIFORD trials reported activity retention through the bake within the wheat and rye bands documented here, confirming that the 69% to 85% range is achievable in a controlled production setting rather than being a laboratory ceiling.
3. Full bioavailability in human trials. Subjects consuming the fortified bread showed measurable improvement in serum 25-hydroxyvitamin D status, confirming that the surviving 69% (rye) to 85% (wheat) fraction remained physiologically active. The heat-stressed molecule, at the retention levels observed, is not measurably degraded to inactive isomers in vivo.
The bioavailability finding is the critical one for policy and labeling. The implication for product specification: a 12 μg/100 g dose in wheat bread delivers approximately 10.2 μg of bioavailable vitamin D3 per 100 g of finished product. For rye, the equivalent figure is approximately 8.3 μg. Both values are sufficient to support a "source of vitamin D" claim under European Union nutrition labeling rules, where the relevant threshold is expressed as a percentage of the nutrient reference value per 100 g of product.
Operational summary
The four-parameter control framework for vitamin D3 in industrial bread production:
1. Matrix pH. Measure dough pH before baking. Wheat at 5.4–5.8 retains approximately 85%. Rye at 4.0–4.8 retains approximately 69%. Blends interpolate linearly with the rye fraction.
2. Oven profile. Specify set-point temperature, residence time, and humidity profile. The reference band is 200–210 °C for 30 minutes with steam injection at the start of the cycle. Document the profile; do not assume it.
3. Crumb core temperature. Verify with a probe at the geometric center of the loaf. Target 98 °C. Lower targets reduce loss but compromise loaf structure; higher targets accelerate loss without proportional volume gain.
4. Dosage overage. Calculate on the final-product dose, not on the flour dose. Overage ranges from 18% (standard wheat, standard bake) to over 40% (rye, low-protection bake). Specify the premix purchase by finished-loaf dose.
The industrial cost of the overage is small relative to the premix commodity cost. Vitamin D3 concentrates at 1360 IU/g in commercial yeast premixes, so the marginal flour cost of compensating a 20% loss is a fraction of a cent per loaf at typical fortification targets. The cost of an under-fortified shipment — a regulatory recall, a label miss, a clinical shortfall in the consumer population — is orders of magnitude higher. The overage is a cheap insurance policy against a measurable process loss.
Unknowns and limits of current data
Two parameters are not fully characterized in the published literature, and any industrial deployment should treat them as the next measurement priority:
- Industrial tunnel oven versus static deck oven kinetics. Heat flux, humidity profile, and residence time distribution differ significantly between oven formats. The retention numbers cited here are derived primarily from deck-oven studies at laboratory and pilot scale. Tunnel oven data is sparse, and direct extrapolation is not warranted without on-site verification.
- Post-bake shelf-life degradation in packaged bread. Vitamin D3 is sensitive to UV light. Packaged bread under opaque film is expected to be stable, but no published dataset covers the 14–30 day retail shelf life under clear-film packaging or open-shelf retail lighting. This is a packaging specification gap, not a baking gap, but it falls within the same mass-balance framework.
A retention number is only as reliable as the oven that produced it.
The oven is the budget line. Storage and fermentation contribute effectively nothing to the loss. The matrix pH sets the floor. The dosage overage closes the gap. Industrial fortification of bread with vitamin D3 is a solved mass-balance problem at the levels required for population-level impact, provided the baker measures dough pH, specifies the oven profile, verifies crumb core temperature, and converts the premix dose to finished-loaf dose before issuing the purchase order.