Optimizing Vitamin D Fortification in Plant-Based Milk Alternatives
A study published in MDPI Applied Sciences applied a three-phase methodology—registry tracking, retail shelf analysis, and consumer surveys—to quantify both the nutritional composition and market…
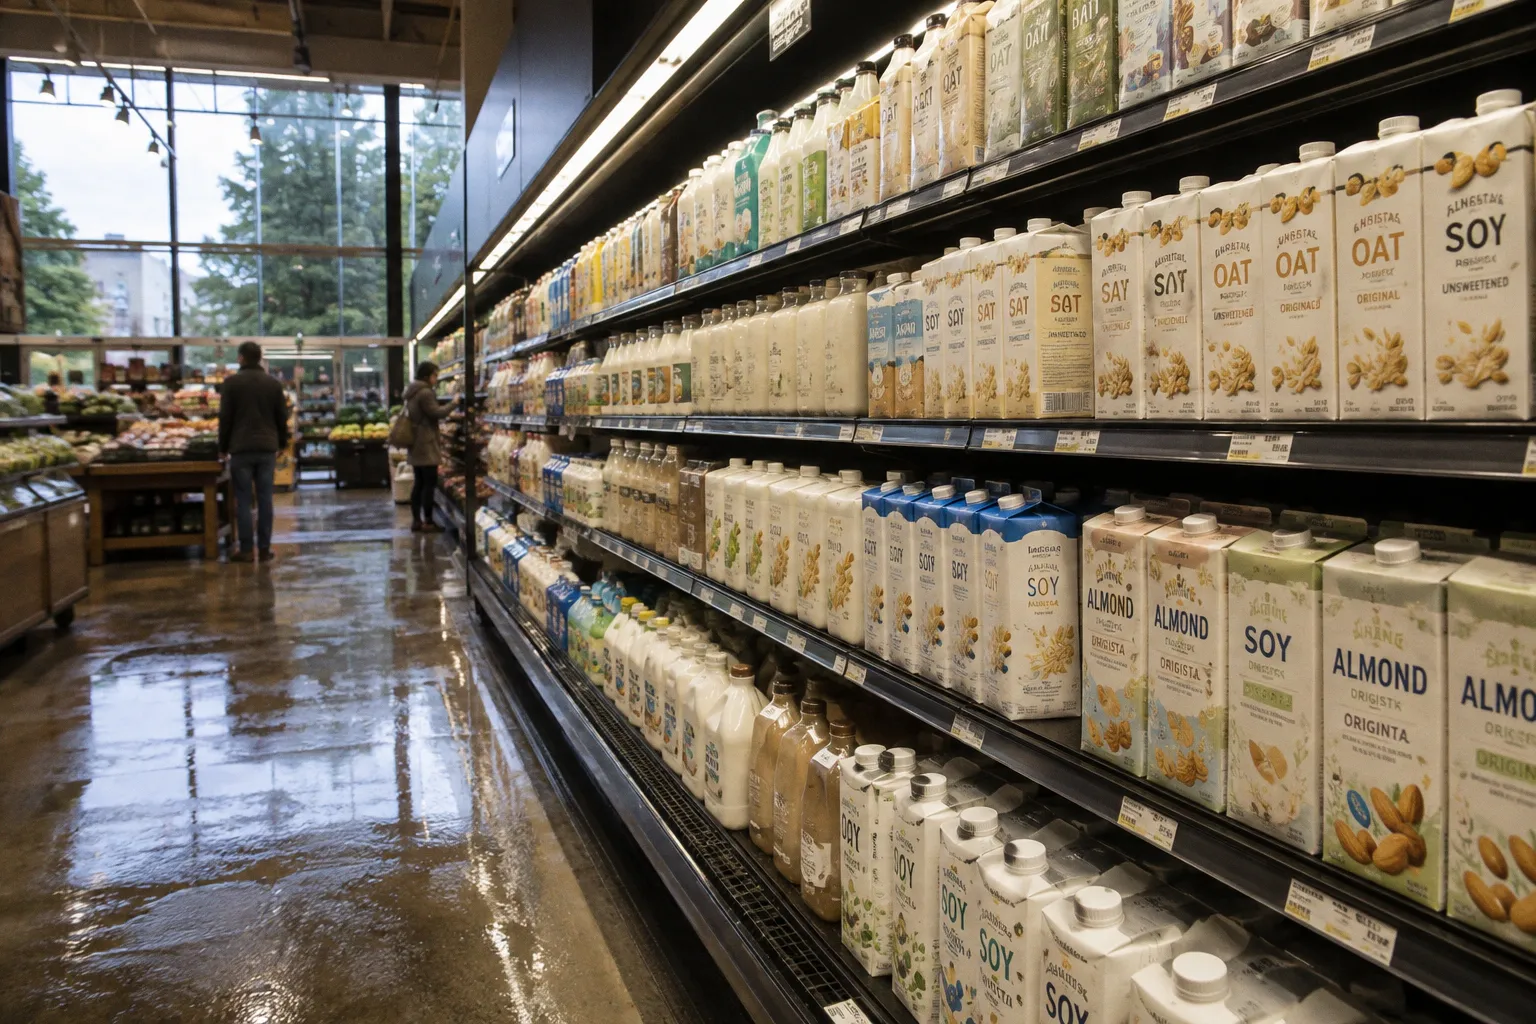
A study published in MDPI Applied Sciences applied a three-phase methodology—registry tracking, retail shelf analysis, and consumer surveys—to quantify both the nutritional composition and market uptake of vitamin D-fortified plant-based milk alternatives. The principal finding: coconut-based fortified beverages registered the highest mean vitamin D content at 0.84 μg per 100 mL across the analyzed product set. For fortification engineers, the result reframes the matrix question. Lipid-rich carriers retain more fat-soluble vitamin through thermal processing than aqueous alternatives, and that has direct implications for premix design and overdosing strategy.
Methodology and Data Streams
The study design combined three discrete components rather than a single survey instrument. The registry phase captured formulation disclosures from product databases, standardizing the declared vitamin D content across manufacturers. The retail shelf phase measured declared versus actual fortification levels through direct product sampling. The consumer survey phase documented purchasing frequency, label-reading behavior, and stated reasons for product selection. This triangulation isolates label-declared values from real-world delivery—a gap that compromises compliance modeling in most single-method audits. The strength of the design is the cross-validation: declared values, measured values, and consumer-side perception all sit in one frame.
Matrix Performance and Process Constraints
The 0.84 μg per 100 mL figure places coconut-based matrices at the top of the measured set. The oil-rich phase of coconut likely supports higher retention of fat-soluble vitamin D during processing compared to aqueous oat or soy matrices, where oxidative degradation and phase separation reduce bioavailability yield. Three process parameters warrant direct monitoring in any reformulation program.
First, matrix encapsulation efficiency in non-coconut bases. Oat and legume systems require additional stabilization—hydrocolloids, emulsifiers, or carrier starches—to match the retention profile of lipid-rich matrices. Second, degradation kinetics during UHT processing. Vitamin D losses in plant matrices typically exceed those in dairy due to the absence of protective milk fat globule structures, requiring compensatory overdosing at the premix stage. Third, label-to-shelf variance. The retail audit component flags where declared fortification diverges from measured content after distribution. Each of these parameters can be quantified through standard accelerated-shelf-life testing.
Cost-Benefit Note for Reformulation
Coconut base delivers the highest measured vitamin D at the lowest matrix intervention cost, but carries the highest raw material price volatility. Oat and soy bases offer lower retention and higher processing input, but operate within established supply chains. The decision variable is target dose per serving against acceptable fortificant overage. Where the target dose is fixed by regulation, higher degradation rates translate directly into higher premix cost per unit. Where the dose is market-driven, lower-retention matrices require heavier consumer education to justify the price premium. The consumer survey component matters here: stated reasons for selection determine whether the label claim drives purchase or merely decorates it.